


April 19, 2024
Private equity (PE) firms rely on accurate metrics and deep analysis thereof to power their investment decisions and maximize returns. Two of these metrics that are widely used and closely related are total value to paid-in capital (TVPI) and distribution to paid-in capital (DPI).
Metrics like these are critical for meeting new Securities and Exchange Commission (SEC) regulations applicable to private fund managers. And, beyond that, understanding and leveraging these measures keep operations clean, transparent, and efficient.
Below, we’ll break down TVPI and DPI, what their implications are, how they compare to other PE performance metrics, and what challenges stand in the way of accurate reporting and analytics—and how to overcome them.
What is total value to paid-in capital?
Total value to paid-in capital divides the overall value of investments by the capital contributed by investors. Another term for TVPI is MOIC – multiple on invested capital. The two may be used interchangeably.
TVPI is a correlational multiple, meaning that a 1.0 (or 1x) TVPI means every dollar invested would return $1. Figures over 1.0 are positive, whereas those under 1.0 are negative.
The easiest way to understand all of this is as a simple equation, specifically:
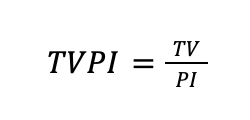
Much of TVPI’s utility comes from its simplicity. Other metrics that offer similar high-level overviews of fund performance (i.e., IRR and MOIC, see below) feature more complex inputs that can be manipulated. In contrast, TVPI is inherently straightforward and transparent.
However, the way that investors arrive at the “total” value necessitates other calculations.
The TV is the sum of distributed capital (D) and residual value (RV)—it’s a combination of D plus RV, all of which is then divided by PI. Put differently, that means TVPI is often expressed as:

To know its TVPI, a firm needs to know its DPI and RVPI. Likewise, to fully appreciate what TVPI is and how it can be used to evaluate PE performance, you need to understand DPI and RVPI.
What is distribution to paid-in capital?
In DPI, “distribution” is distributed capital, which is also sometimes referred to as cumulative distributions. Like TVPI, this value is divided by the amount of paid-in capital, or contributed funds from investors. Other names for DPI include “cash on cash” and “realization multiple.”
Also like TVPI, DPI is a straightforward correlational figure (i.e., 1.0 or 1x), wherein a DPI over 1.0 is positive, but a DPI under 1.0 can be viewed as negative, but could also reflect the current point in the fund’s lifetime and unrealized value to be returned as the fund exits its investments. DPI also changes over time in relation to TVPI. In the earliest stages of an investment, DPI will be 0.0 by default. Over time, and with success, DPI will eventually reach at least 1.0, indicating that all invested funds have been returned. Then, the hope is that DPI will continue to increase well above 1.0 as it takes on a bigger share of TVPI.
What is residual value to paid-in capital?
The other part of TV is residual or unrealized value. It is the current market value of funds that have been contributed to the firm but have not been converted into returns, often represented as a multiple or percent. It’s also identical to and interchangeable with net asset value (NAV).
RVPI as a whole is an estimate of future value, albeit one that is subject to change.
RV and RVPI also change over time in an inverse relationship with D and DPI. Namely, RVPI is at its absolute highest (and equal to TVPI) right at the start of an investment’s lifespan. Then, over time, it will eventually winnow down to 0.0 as DPI takes over and makes up all of TVPI.
The implications of TVPI, DPI, and RVPI
The reasons investors value TVPI, DPI, and RVPI have to do with straightforward representation of a fund’s overall, to-date, and future performance. In a single, easy-to-parse figure (i.e., 2.0 or 2x), they indicate exactly how well (or poorly) a fund is, has, and will perform (respectively).
Some of the most important implications of each metric are:
- TVPI – This is an overall measure of a fund’s performance in terms of how much value it has already generated and how much it could potentially generate still. When looking at TVPI at a given point in time, it illustrates how past earnings will compare to future ones.
- DPI – This is a measure of a fund’s performance to date, irrespective of what could happen in the future. DPI is an excellent measure of a firm’s facility and efficiency in creating actual cash returns for its investors (as opposed to possible future earnings).
- RVPI – This is a future-focused measure that provides insights into both how much total return is possible in the coming years. It’s a key countermeasure, especially against poor DPI or TVPI; it can indicate that brighter days are ahead and how far out they likely are.
While it’s tempting to think about these metrics as options and focus on just one or two of them, it’s impossible to completely isolate them from each other. The best assessment comes from deep dives into and across all three figures—and other, similar performance metrics.
TVPI vs. other important PE metrics
As noted above, TVPI, DPI, and RVPI all have other metrics that they’re interchangeable with.
So, another way to understand the impact of these metrics is to consider them alongside other common measures of PE performance. The firms best prepared to report on and analyze their performance (and optimize it) aren’t choosing between these; instead, they’re leveraging all available metrics for distinct reasons to understand what their returns are, could be, and why.
TVPI vs. internal rate of return (IRR)
Internal rate of return (IRR) is a measure of growth over time. Despite its ubiquity, it’s notorious for being hard to calculate. However, investors value the way it can generate a “hurdle rate,” or general benchmark for return (as a percent) at which an investment is considered successful.
The academic formal representation for IRR calculation is as follows:
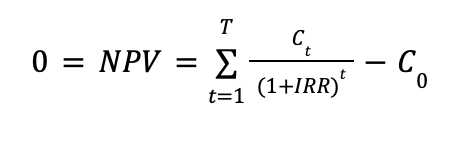
In this formulation, NPV is the net present value, which is always set to zero. The t represents the number of periods; Ct is net cash flow, C0 is investment cost, and IRR is extremely hard to parse.
However, a more accessible version can be expressed as:
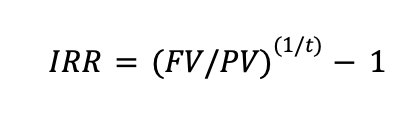
Here, FV and PV are future and present values, respectively, and t is the number of periods.
As these calculations illustrate, IRR at its absolute simplest is more complicated than TVPI. What that means, in practice, is that there’s much more room for manipulation; when presenting (or being shown) IRR, it’s important to bake in context to ensure full accuracy and transparency.
TVPI vs. multiple on invested capital (MOIC)
Multiple on invested capital (MOIC) is much closer to TVPI in terms of its inputs, outputs, and simplicity. As the name implies, it is represented as a correlational multiple (i.e., 3.0 or 3x). But, in this case, the calculation divides something similar to TVPI’s total value—realized value (RV) and unrealized value (UV)—by the initial investment rather than the sum of paid-in capital.
The most common formulaic representation of MOIC is something like:
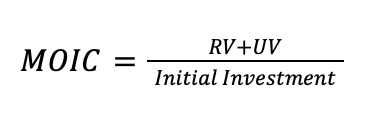
The biggest practical difference between TVPI and MOIC is the denominator.
However, that difference dissipates over time. Before investors are fully committed, TVPI will be higher than MOIC. But once they have reached the full paid-in total, MOIC will be identical to TVPI. As such, MOIC is most distinctly useful in the earlier stages of investment, alongside RVPI.

Challenges in evaluating and operationalizing PE metrics
Beyond the complexity of the actual mathematics, many firms and investors face an uphill battle with TVPI and other PE metrics. Common culprits are the availability and accessibility of data, along with inadequate storage and compute resources for aggregation, analysis, and reporting.
In addition, BIP Ventures explains the following potential challenges with TVPI specifically:
- Overstatement of unrealized investments and optimistic projections
- Selective reporting of successful investments and future valuations
- Short-term bias stemming from over-emphasis on realized gains
- Lacking information and context about risks to investments
There are also potential pitfalls in DPI, which contribute to further risks at the aggregate level when combining DPI and RVPI into TVPI. A careful approach is the best way to avoid all of them.
And, beyond the level of individual firms, researchers also face challenges in benchmarking performance across the industry. A 2022 study from Unigestion illustrates how commonly used databases can lead to inaccurate conclusions and ill-informed decisions. The main reasons for this include the diversity in strategies amongst peer groups, the self-reported nature of most data gathered, and the underlying complexity of these calculations (especially IRR). Together, these factors make for volatile benchmarks that investors should approach with caution.
Leveraging data analysis for PE assessment
At Allvue, we’re committed to helping firms and their stakeholders understand the full scope of their investments’ performance. That process starts and ends with data processing, including both intake and careful monitoring of outputs. We’ve created a suite of software tools to meet the exact needs of PE funds with respect to TPVI, DPI, RVPI, IRR, MOIC, and other calculations.
To see firsthand what our private equity software solution can do for you, request a demo.
Or contact Allvue today to learn more about our innovative solutions.
Sources:
BIP Ventures. Understanding TVPI, DPI, and IRR: Key Metrics for Informed Private Capital Investors. https://www.bipventures.vc/news/understanding-tvpi-dpi-and-irr-key-metrics-for-informed-private-capital-investors
Finance Stu. MOIC vs. ROIC: Difference Fully Explained In 3 Easy Steps. https://financestu.com/moic-vs-roic/
Unigestion. The Challenges of Benchmarking Private Equity Performance. https://www.unigestion.com/insight/the-challenges-of-benchmarking-private-equity-performance/